Zabbix vs Prometheus which is the best ? In this article, I am presenting my first experience with Zabbix and why I decided to choose it.
The context
For my new mission, I had to maintain a monitoring tool called Centreon and I almost immediately disliked it. In its OSS version, you go a clunky interface, even a fresh install is not properly working, the synchronization system with the broker is awkward and not automatic. I also had permanent issues with the communication system.
Since we are in 2019 and we are talking about DevOps, automation and REST API, I thought we could do better. Last year, I have been working with AppManager from ManageEngine and was quite happy though it is pretty expensive.
For this new mission, the expectations are lower and the budget is lower too. Therefore I decided to set my interest on the open-source/freemium alternatives.
My own preferences have already discarded :
- Icinga : OK it’s Nagios in better, but it’s still Nagios
- Shinken : I used it 6 years ago, was happy with it, but now it’s time of something better
- Centreon : Never, not ANYMORE
- Senzu : I like the concept but I feel that it is going to be a nightmare to set in production with its relatively small community.
My interest will be the fight between :
| Prometheus + Grafana | Zabbix |
I will check especially the following aspects of these software :
- UI discovery
- Adding a host
- Testing the host connectivity
- Handling SNMP
- Alerts and notification
- Adding a host through REST API.
Prometheus + Grafana
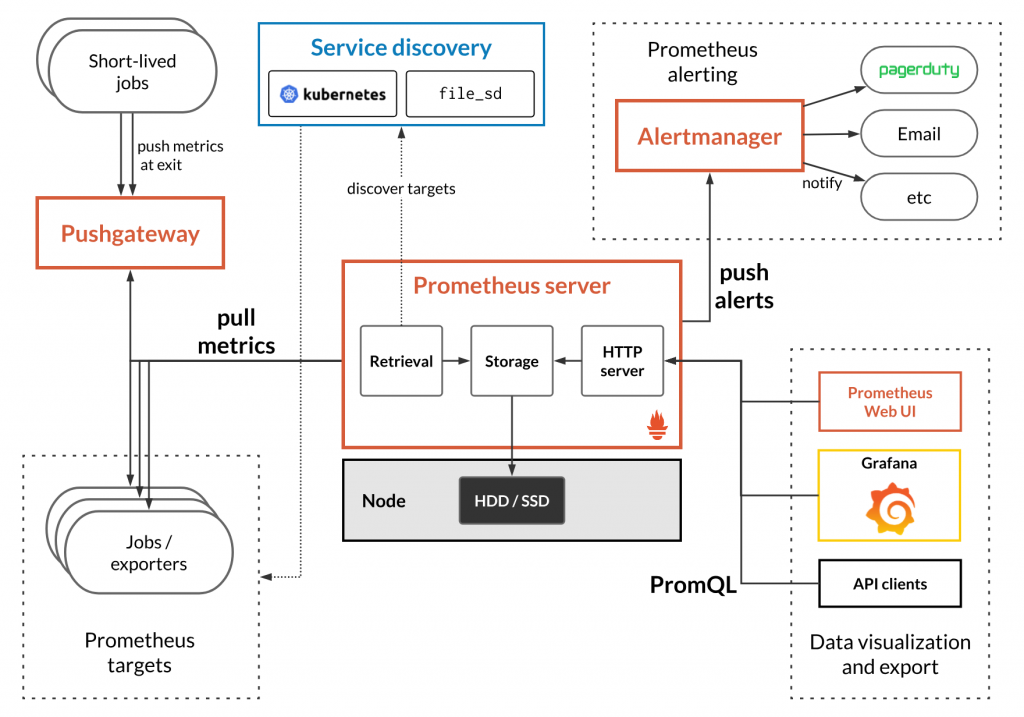
Prometheus is a flexible monitoring solution that is in development since 2012. The software stores all its data in a time series database and offers a multi-dimensional data-model and a powerful query language to generate reports of the monitored resources.

Installation
Prometheus server supports Docker container deployment and is quite easy.
It takes a YML file to configure the server :
global:
  scrape_interval:     15s # By default, scrape targets every 15 seconds.

  # Attach these labels to any time series or alerts when communicating with
  # external systems (federation, remote storage, Alertmanager).
  external_labels:
    monitor: 'codelab-monitor'

# A scrape configuration containing exactly one endpoint to scrape:
# Here it's Prometheus itself.
scrape_configs:
  # The job name is added as a label `job=<job_name>` to any timeseries scraped from this config.
  - job_name: 'prometheus'

    # Override the global default and scrape targets from this job every 5 seconds.
    scrape_interval: 5s

    static_configs:
      - targets: ['localhost:9090']
If it’s simple, the first drawback of the solution is that Prometheus offers by default a static configuration, nothing dynamic. If you want to monitor dynamically your hots (adding /removing them), you will have to pick a service discovery. In my case, I tried to use Consul.
UI discovery
The UI is simple but really basic and really far from what we are used to get with Zabbix, Nagios or Centreon.

You can produce dashboard using Grafana with a complete integration :

However the whole integration was cumbersome and fragile. Prometheus itself is a great product but the combination of several software implies a huge load of configuration, administration and debugging. I did not retained that solution.
Related documentation :
- https://visibilityspots.org/prometheus-consul.html
- https://github.com/visibilityspots/nomad-consul-prometheus
Zabbix

Installation
Zabbix provides many ways to install their software, appliance, docker and docker-compose and fairly good documentation.
Basically, you will have four docker containers to install including a Mariadb/Mysql server.

The installation goes really easily.
UI discovery
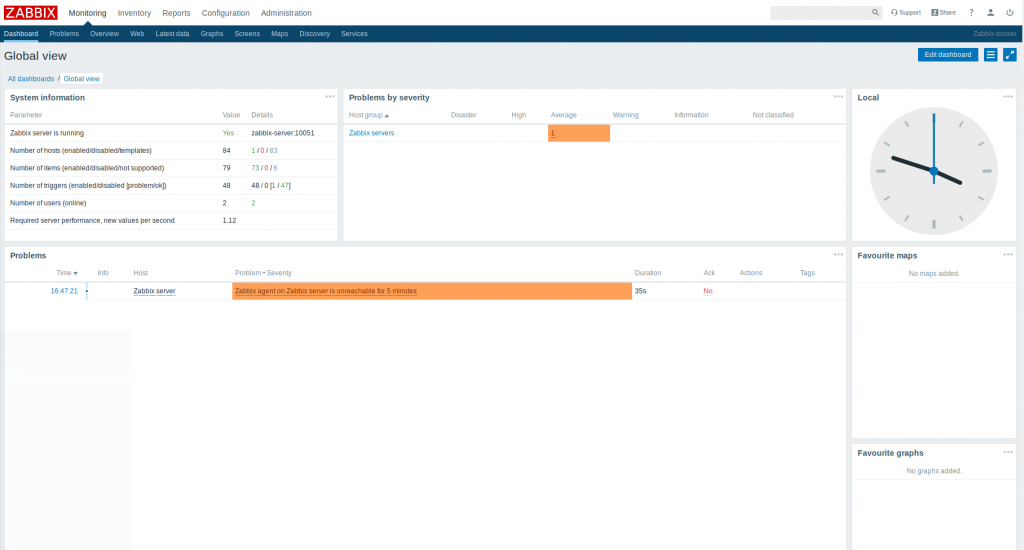
The UI is using authentication and is quite clear.

Adding a host
Zabbix is offering a auto-discovery module, however I have not been able to add automatically hosts.

Really importations the discovery actions are hidden with a filter on the top right corner of your dashboard :

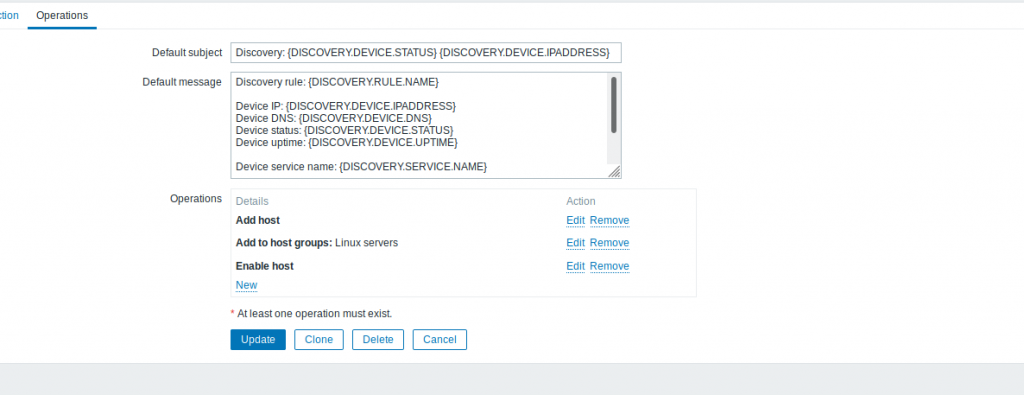
You will have to create a discovery action, it’s really super simple to program.


Handling SNMP
Alerts and notification
The alerts and notifications are handled in the Media Type section of the administration (weird section name by the way).

By the way I recommend you to test your configuration with a service like Mailtrap.io and once everything is configured, let’s switch to your own smtp relay.

Your users have to declare a Email media type.

You also need to program Actions (in Configuration menu) to trigger mail notifications.

Adding a host through REST API.
Apart the auto-discovery, Zabbix is offering a REST API.
Conclusion
I retained Zabbix for the following advantages versus Prometheus.
The association of the Zabbix actions (auto-registration, discovery and triggers) makes the solution really easy and cheap to implement. Each time I am installing a Zabbix agent, depending of the hostname, it will associate properly a ready-made template of sensors, configuration, graphs and health checks.
This template feature is easy to configure and powerful. I built a large HTTP/HTTPs scanner which creates automatically hosts to monitor with the associated health checks. Hence I am detecting when an Apache2 server had a dysfunction.
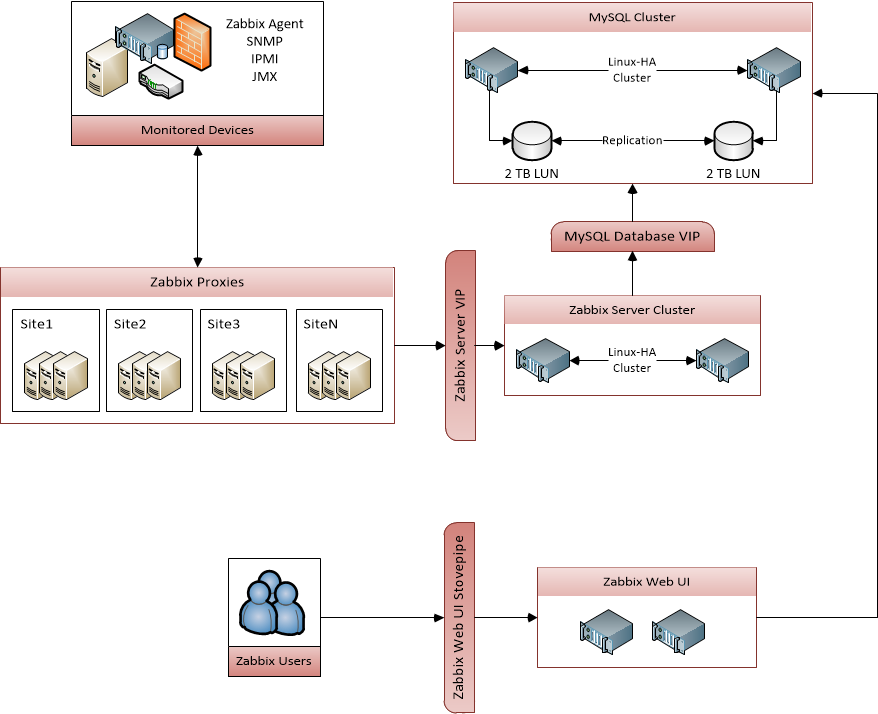
The architecture has a big plus with the notion of agent, proxies and servers. It allows us to have VM and services through different cloud providers and aggregate the data securely.
Finally, the UI is easier to use compared than AppllcationManager and Centreon, but that’s a personal opinion.
Next things to study :
Nomad : https://www.nomadproject.io/
Donate to the blog
[wpedon id=”1721″ align=”center”]

