Zabbix vs Prometheus — which is the best monitoring tool? I first wrote about this question in 2019, when I was tearing out a monitoring stack I disliked and evaluating open-source replacements. Since then I’ve designed observability for cloud migrations, run both tools in production, and watched each one evolve substantially. So this is the honest, hands-on answer I’d give a client today: not “one wins”, but which one wins for you, and why.
Originally published August 2019, fully rewritten and updated August 2026 to cover Prometheus 3.x and Zabbix 7.x LTS, and to reframe the comparison the way I now brief architecture teams.
The short version
If you’re monitoring a cloud-native, containerised, ephemeral environment — Kubernetes, autoscaling services, microservices that come and go — Prometheus is almost always the right foundation. If you’re monitoring long-lived infrastructure — servers, network gear over SNMP, appliances, databases, mixed on-prem and cloud estates that need out-of-the-box templates and a built-in UI — Zabbix will get you to production faster with less glue.
Most real enterprises I work with end up running both, and that’s fine. Keep reading for the reasoning, a full comparison table, and concrete “choose this when” scenarios.
Where I’m coming from
Back in 2019 I inherited a Centreon install I couldn’t stand: a clunky OSS interface, a broker synchronisation system that wasn’t automatic, and constant communication issues. I’d already ruled out the usual suspects — Icinga (better Nagios, still Nagios), Shinken (loved it once, moved on), and Sensu (nice concept, painful in production for a small team). The real fight was Prometheus + Grafana versus Zabbix.
I chose Zabbix then, mostly for its auto-registration and template model. Seven years later I still think that was the right call for that context — but the context matters enormously, and both tools are very different products now than they were then. Prometheus has become the de facto standard for cloud-native metrics, and Zabbix has quietly turned into a genuinely scalable enterprise platform. Let me explain what actually changed.
Prometheus in 2026
Prometheus is a metrics-first monitoring system built around a time-series database and a pull model: the server scrapes HTTP endpoints that expose metrics, stores them locally, and lets you query them with PromQL, its multi-dimensional query language. It’s a CNCF graduated project and the reference implementation for cloud-native monitoring.
The big shift since 2019 is Prometheus 3.0, the first major version in seven years (released late 2024), followed by a steady 3.x line through 2025–2026. What matters in practice:
- A rebuilt web UI — the old bare-bones expression browser is gone, replaced by a much more usable interface (the old page called Prometheus itself “really basic”, and that critique no longer holds).
- Native histograms, which reached stable status in the 3.x line. They store far more granular latency/distribution data at a fraction of the cardinality cost of the old bucketed histograms — a real fix for one of Prometheus’s historic pain points.
- Native OpenTelemetry (OTLP) ingestion, so Prometheus can accept OTLP metrics directly. This is a big deal: it puts Prometheus at the centre of an OpenTelemetry pipeline instead of on the side of it.
- Remote-Write 2.0, improving how metrics ship to long-term/remote storage backends.
Prometheus’s architecture is still deliberately simple: a single binary, local TSDB, and a companion Alertmanager for routing and deduplicating alerts. Dashboards are Grafana’s job — Prometheus is the data source, Grafana is the face. That separation is a strength (best-in-class visualisation) and a cost (it’s one more system to run).
The two honest drawbacks remain:
- It’s a pull model with dynamic targets. Static config is trivial; monitoring an estate that changes means wiring up service discovery (Kubernetes SD is first-class, plus Consul, EC2, Azure, GCE, and file-based SD). In containerised environments this is a feature — targets appear and disappear automatically. On classic infrastructure it’s more setup than Zabbix’s agent auto-registration.
- Long-term storage and horizontal scale are not built in. A single Prometheus scales impressively vertically, but for global, highly-available, multi-year retention you reach for Thanos, Cortex/Mimir, or a remote-write backend. Powerful, but it’s an ecosystem to assemble — exactly the “combination of several software” cost I flagged in 2019.
Zabbix in 2026

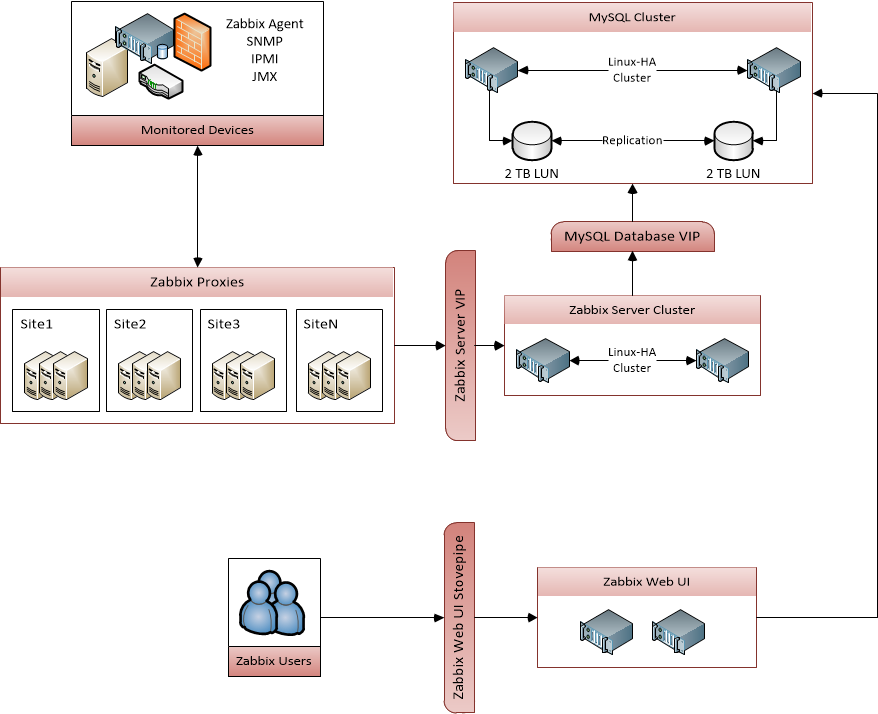
Zabbix is a mature, enterprise-class open-source monitoring platform. Unlike Prometheus, it’s a complete product: server, database, web frontend, alerting, dashboards, discovery, and agents all in one project, all under the AGPLv3 licence.
The headline release since 2019 is Zabbix 7.0 LTS (mid-2024), continued by the 7.x line. The features that genuinely change the architecture conversation:
- Proxy high availability and load balancing via proxy groups. You can now assign hosts to a group of proxies that automatically distribute the load and fail over between themselves. This directly answers the old “does Zabbix scale?” objection — you scale by adding proxies to a group, and the estate rebalances itself.
- Synthetic end-user web monitoring — browser-based checks of real user journeys, not just endpoint pings.
- Native multi-factor authentication (MFA) on the frontend, plus continued SAML/LDAP support.
- Asynchronous, high-throughput data collection and in-memory metric handling on proxies, which meaningfully raised the metrics-per-second ceiling.
Zabbix’s model is the mirror image of Prometheus. It leans on a push/agent model (agents report in; the server can also actively poll), stores everything in a relational database (MySQL/MariaDB/PostgreSQL, or TimescaleDB for time-series optimisation), and ships with a full web UI out of the box.
Its enduring superpower — the one that won me over in 2019 and still holds — is the template + auto-registration + discovery trio. When a Zabbix agent registers, Zabbix can match it by hostname or metadata and automatically apply a ready-made template of items, triggers, graphs and health checks. I once built a large HTTP/HTTPS scanner that auto-created monitored hosts with the right checks attached, so an Apache dysfunction surfaced on its own. That “install agent → correct monitoring appears” loop is still far smoother than assembling the equivalent in the Prometheus ecosystem. Zabbix also handles SNMP, IPMI, and agentless checks natively — a real advantage for network and hardware monitoring, where Prometheus needs exporters.
The trade-off: Zabbix carries a relational database at its core. It scales well now with proxy groups and TimescaleDB, but the DB is the component you’ll tune and babysit at very large scale, and its data model is less naturally suited to the high-cardinality, label-heavy world of microservices than Prometheus’s is.
Zabbix vs Prometheus: head-to-head comparison
| Dimension | Prometheus (+ Grafana + Alertmanager) | Zabbix 7.x |
|---|---|---|
| Architecture | Single binary + local TSDB; Alertmanager and Grafana are separate. Assemble your stack. | All-in-one: server + DB + web UI + proxies + agents in one product. |
| Data model | Multi-dimensional, label-based time series. Ideal for high-cardinality, dynamic metrics. | Item/host/template model in a relational DB. Structured, predictable, less label-heavy. |
| Collection | Pull — scrapes HTTP /metrics endpoints (exporters expose them). | Push + poll — agents report in; server can actively poll. SNMP/IPMI native. |
| Query language | PromQL — powerful, purpose-built for time series. | Zabbix expressions/trigger syntax + built-in aggregations. Less expressive, more turnkey. |
| Alerting | Alertmanager: rich routing, grouping, silencing, dedup. Alert rules live in Prometheus. | Built-in triggers, actions, escalations, media types. No extra component. |
| Scaling | Vertical by default; horizontal/HA/long-term via Thanos, Mimir, or Cortex. | Proxy groups with auto load-balancing + HA (7.0); TimescaleDB for time-series scale. |
| Storage | Local TSDB (short/medium term) + remote-write to long-term backends. | Relational DB (MySQL/MariaDB/PostgreSQL/TimescaleDB). You operate the DB. |
| UI / dashboards | Rebuilt native UI in 3.x; Grafana for real dashboards (best-in-class). | Full built-in web UI + dashboards. No extra tool needed. |
| Service discovery | First-class: Kubernetes, Consul, EC2, Azure, GCE, file-based. | Network/agent auto-discovery + agent auto-registration with template matching. |
| Integrations | Huge exporter ecosystem; native OTLP ingestion in 3.x. | REST/JSON-RPC API, huge template library, native SNMP/IPMI/JMX. |
| Learning curve | Steeper — PromQL + assembling the ecosystem. | Gentler to a working state; complexity grows at large scale. |
| Licence | Apache 2.0 (CNCF graduated). | AGPLv3. |
| Best-fit use case | Cloud-native, Kubernetes, microservices, autoscaling, ephemeral targets. | Servers, network/SNMP, appliances, DBs, mixed on-prem + cloud estates. |
When to choose which
The comparison table tells you what differs. Here’s how I actually decide on a project.
Choose Prometheus when…
- You run Kubernetes or any orchestrated, autoscaling platform. Prometheus + kube-state-metrics + the Kubernetes SD is the native, well-trodden path, and the whole cloud-native tooling ecosystem assumes it’s there.
- Your targets are ephemeral — containers, spot instances, functions — and you need discovery to add/remove them automatically without human action.
- You’re building around OpenTelemetry. With native OTLP ingestion in 3.x, Prometheus fits cleanly as the metrics backend of an OTel pipeline.
- You want Grafana dashboards and you’re happy running Alertmanager and (for scale) a long-term storage layer.
- Your team is comfortable owning several composable components rather than one product.
Choose Zabbix when…
- You monitor long-lived infrastructure: physical/virtual servers, network devices over SNMP, storage arrays, IPMI hardware, databases, appliances.
- You want a single product that ships with UI, alerting, discovery and dashboards — minimal glue, fast to a working state, one thing to operate.
- The template + auto-registration model matches how you work: install an agent, get the right monitoring automatically. This is Zabbix’s killer feature and it’s genuinely excellent.
- You have a mixed estate (on-prem + multiple clouds) and want to aggregate it securely through the server → proxy → agent hierarchy — now with proxy-group HA and load balancing.
- Your team prefers configuration through a UI/API over writing PromQL and wiring exporters.
Use both when…
This is the reality at most enterprises, and it isn’t a cop-out. A clean split:
- Prometheus owns the cloud-native / application layer — Kubernetes, microservice latency and RED/USE metrics, autoscaling signals — visualised in Grafana.
- Zabbix owns the infrastructure layer — network gear, hardware, databases, VMs, on-prem — with its templates and native SNMP.
You can even surface both in one Grafana instance (Prometheus as a data source, Zabbix via the Zabbix Grafana plugin), giving a single pane of glass without forcing one tool to do a job it’s bad at.
A concrete example from the field
To make the “split by layer” idea real, here’s the pattern I’ve deployed on a hybrid migration. The client had a fleet of on-prem VMware hosts, a stack of network switches and firewalls, a couple of Oracle and PostgreSQL databases, and a growing set of workloads being migrated onto Kubernetes in the cloud.
We didn’t try to force one tool over everything. Instead:
- Zabbix monitored the on-prem and network layer. SNMP for the switches and firewalls, the Zabbix agent (with proxy groups per site) for the VMs, and native database templates for Oracle and PostgreSQL. When a new VM was provisioned, its agent auto-registered against a hostname convention and inherited the correct template automatically — no ticket, no manual dashboard building.
- Prometheus monitored the Kubernetes side. The Kubernetes service discovery picked up pods as they scaled, exporters exposed application RED metrics (rate, errors, duration), and native histograms gave us honest latency percentiles without cardinality blowing up. Long-term storage went to a remote-write backend so we could keep months of history without bloating the local TSDB.
- Grafana sat on top of both, with Prometheus as a native data source and Zabbix behind its plugin. On-call engineers got one place to look; each tool did the job it’s genuinely good at.
Alerting followed the same split: Zabbix’s built-in actions and escalations handled infrastructure alerts (a switch port down, a filesystem filling up), while Alertmanager handled the Kubernetes/application alerts with proper grouping and silencing during deploys. The lesson that keeps repeating: fighting a tool’s model is far more expensive than picking the right tool per layer.
Common mistakes I see
A few recurring anti-patterns worth naming, because they cost teams months:
- Forcing Prometheus onto static infrastructure. Teams standardise on Prometheus “because it’s the standard”, then hand-maintain long lists of static targets and reinvent SNMP with exporters. On classic infrastructure, Zabbix’s discovery and native SNMP would have been a fraction of the effort.
- Forcing Zabbix onto ephemeral workloads. Trying to track short-lived containers as long-lived hosts in a relational DB fights the data model. High-churn, high-cardinality metrics are exactly what Prometheus’s label-based TSDB is built for.
- Skipping long-term storage planning with Prometheus. A single Prometheus is not your archive. Decide early whether you need Thanos/Mimir or remote-write, or you’ll discover the retention limit during an incident post-mortem.
- Ignoring the database with Zabbix at scale. The relational DB is the component that will hurt if neglected. Use TimescaleDB and plan housekeeping/partitioning before you’re at millions of metrics.
- Treating dashboards as the deliverable. With either tool, the value is trustworthy alerts and signal, not screenshot-friendly graphs. Design alerting first; dashboards support investigation, they don’t replace it.
FAQ
Is Prometheus better than Zabbix?
Not universally — they’re optimised for different worlds. Prometheus is better for cloud-native, dynamic, high-cardinality metrics and integrates with the whole CNCF/OpenTelemetry ecosystem. Zabbix is better for classic infrastructure, network/SNMP, and teams who want a complete product out of the box. “Better” depends entirely on what you’re monitoring.
Can you use Zabbix and Prometheus together?
Yes, and it’s a common, sensible pattern. Let Prometheus handle Kubernetes and application metrics while Zabbix handles infrastructure, network and hardware. You can unify the view in Grafana (Prometheus natively, Zabbix via its plugin), or even scrape Zabbix-exported metrics into Prometheus if you want everything in one TSDB.
Which is easier to get started with?
Zabbix reaches a useful state faster thanks to its bundled UI, templates and auto-registration. Prometheus is quick to stand up but only becomes powerful once you’ve learned PromQL, added exporters, and (for anything serious) set up Grafana, Alertmanager and long-term storage.
Conclusion — my recommendation
In 2019 I picked Zabbix, and for the infrastructure-heavy, budget-constrained context I was in, it was the right call — the template and auto-registration model made monitoring cheap to implement and hard to get wrong.
In 2026 my recommendation is more nuanced because both tools grew up. If your world is cloud-native and containerised, start with Prometheus — it’s the ecosystem standard, and version 3.x removed most of the friction I complained about in 2019 (the UI, histograms, and OTLP ingestion in particular). If your world is servers, networks and mixed estates, start with Zabbix — proxy-group HA finally answers the scaling objection, and nothing beats its “install agent, get correct monitoring” loop.
And if you’re a larger organisation spanning both worlds, run both, split by layer, and unify in Grafana. Pick the tool that fits the shape of what you monitor — that decision, not brand loyalty, is what makes an observability stack that people actually trust.
Resources
- Prometheus documentation — official docs
- Prometheus native histograms — the stabilised histogram spec
- What’s new in Zabbix 7.0 LTS — official release notes
- Zabbix 7.0 proxy load balancing — the HA/scaling feature explained
- Zabbix REST/JSON-RPC API — automating host management
Any opinions in this article are my own.