
 by
by This article has been written as “basic knowledge” for Junior Java developers to help them tracking their bugs in Java software.
Contents
Damn another tool list
I don’t have the ambition for this article to draw a global picture for all available tools in the JEE Ecosystem. No at all, it’s a basic highly subjective list of my favorite tools when I have to deal with Java performance or Java applications in production.
List the Java processes
OK, on Unix, there are a LOT of commands to obtain the same result.
ps -edf | grep java
Output :
$>ps -edf | grep java

uharcom   1751     1 99 15:14 pts/0    00:00:02 /usr/bin/java -Djava.util.logging.config.file=/data/uharcom/tomcat/conf/logging.properties -Djava.util.logging.manager=org.apache.juli.ClassLoaderLogManager -Djdk.tls.ephemeralDHKeySize=2048 -Xms512m -Xmx8192m -XX:MaxPermSize=256m -Xms512m -Xmx8192m -XX:MaxPermSize=256m -Dignore.endorsed.dirs= -classpath /data/uharcom/tomcat/bin/bootstrap.jar:/data/uharcom/tomcat/bin/tomcat-juli.jar -Dcatalina.base=/data/uharcom/tomcat -Dcatalina.home=/data/uharcom/tomcat -Djava.io.tmpdir=/data/uharcom/tomcat/temp org.apache.catalina.startup.Bootstrap start
But do you know that the JDK offers something better ?
jps
Output :
1751
Thread dumps
Is your application slow ? What is really happening ?
One way to have a diagnostic, is to suspend temporarily the application to print where the execution is stopped.
The thread dump can be a result.
To obtain the thread dump, you can use the following command : jstack PID
Usage:
jstack [-l] <pid>
(to connect to running process)
jstack -F [-m] [-l] <pid>
(to connect to a hung process)
jstack [-m] [-l] <executable> <core>
(to connect to a core file)
jstack [-m] [-l] [server_id@]<remote server IP or hostname>
(to connect to a remote debug server)
Options:
-F to force a thread dump. Use when jstack <pid> does not respond (process
is hung)
-m to print both java and native frames (mixed mode)
-l long listing. Prints additional information about locks
-h or -help to print this help message
Profiling
Jstat is an useful tool to perform profiling on a running process.
Official link : https://docs.oracle.com/javase/7/docs/technotes/tools/share/jstat.html
Obtain the classloader statistics : jstat -class PID
Obtain the garbage collector statistics : jstat -gc PID
jvisualvm is a powerful tool to track an monitor several statistics of an Java application.
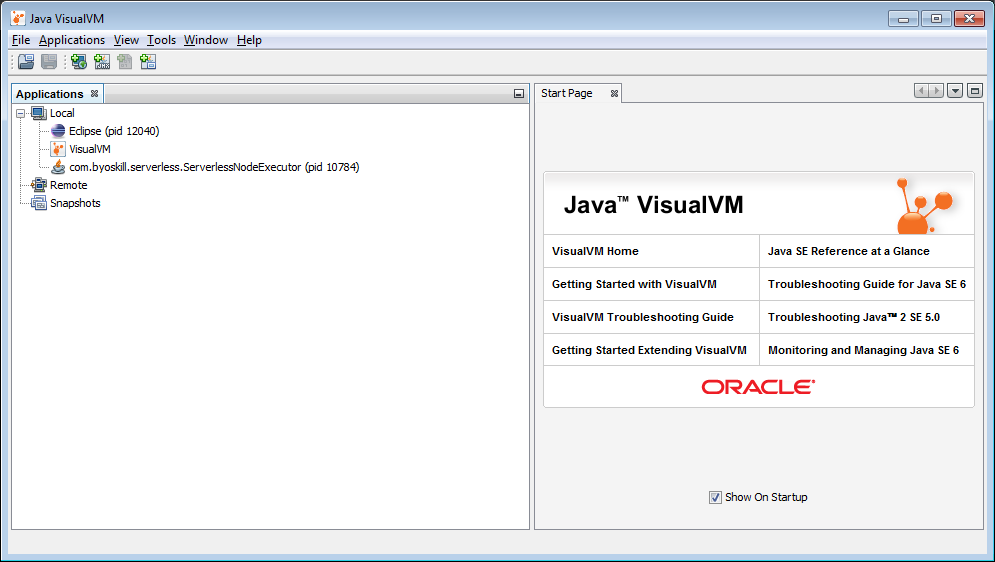
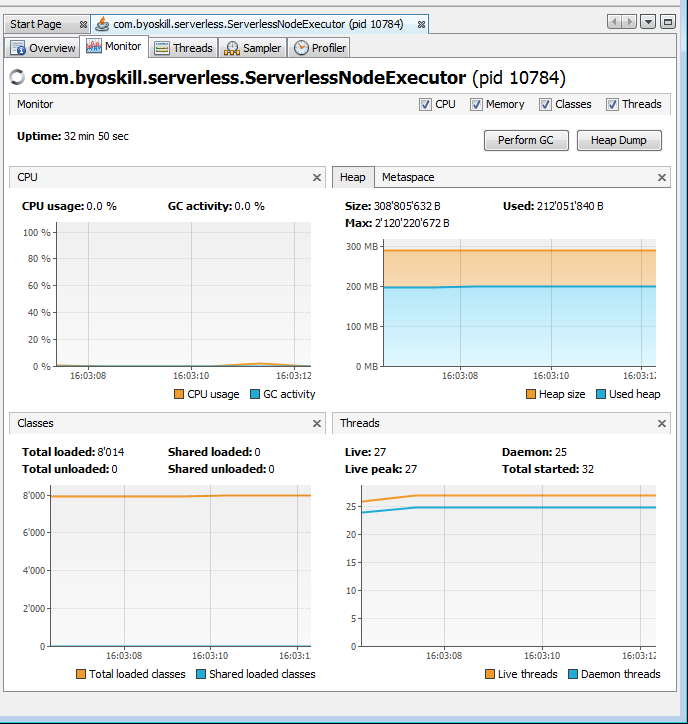
If you can start your application on your machine, or your IDE, this tool is really useful to check the CPU and the memory Usage and to generate CPU and memory profiling.
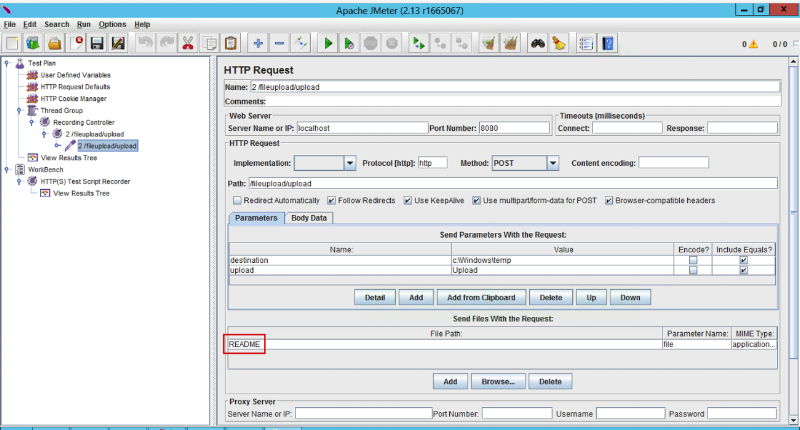
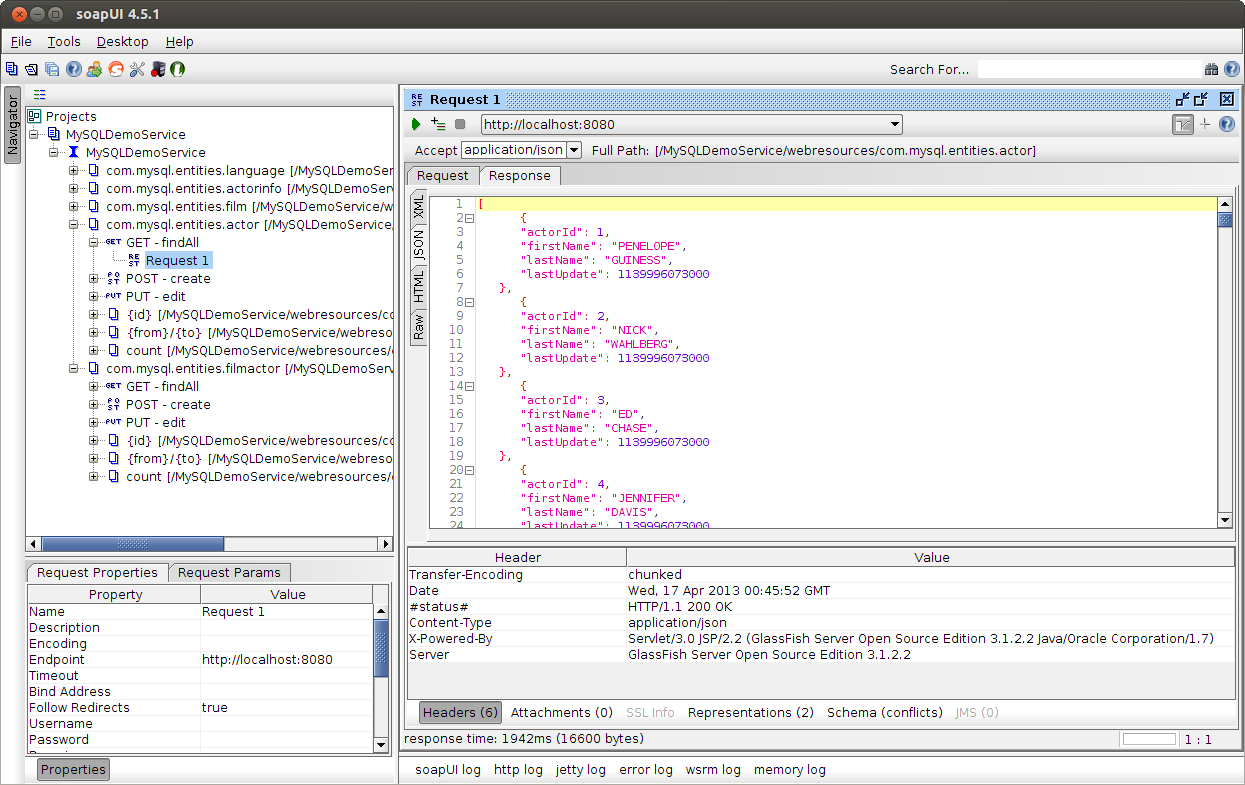
JMeter, Gatling, Soap UI : Write your REST tests and executes stress tests
JMeter, Gatling and Soap UI are three tools every REST backend developers should know. They are easy to use, cheap and allow you to write different kind of automated tests : non-regression tests, performance and stress tests, functional tests.

Bonus : a nice curated list
Check the github page : https://github.com/Vedenin/useful-java-links for a nice curated list.